How to Build a Self-Funded Health Plan Dashboard That CFOs Actually Trust
July 4, 2026
Why the Standard Reporting Package Is Not a Decision Tool
Most CFOs of self-funded employers receive a reporting package from their carrier or third-party administrator. It usually arrives as a PDF, often weeks or months after the period it describes, and it presents costs at a high level: total paid claims, administrative fees, and a few trend lines. That format is useful for confirming what already happened, but it is not a tool for making decisions.
The deeper problem is that the report is produced by the same organization the dashboard is supposed to measure. The carrier or TPA controls the data, selects the categories, and decides what level of detail to show. Fees, network arrangements, pharmacy rebates, and stop-loss terms can be summarized in ways that hide more than they reveal. A CFO looking at that report is essentially being asked to accept a vendor's own scorecard on the vendor's own performance.
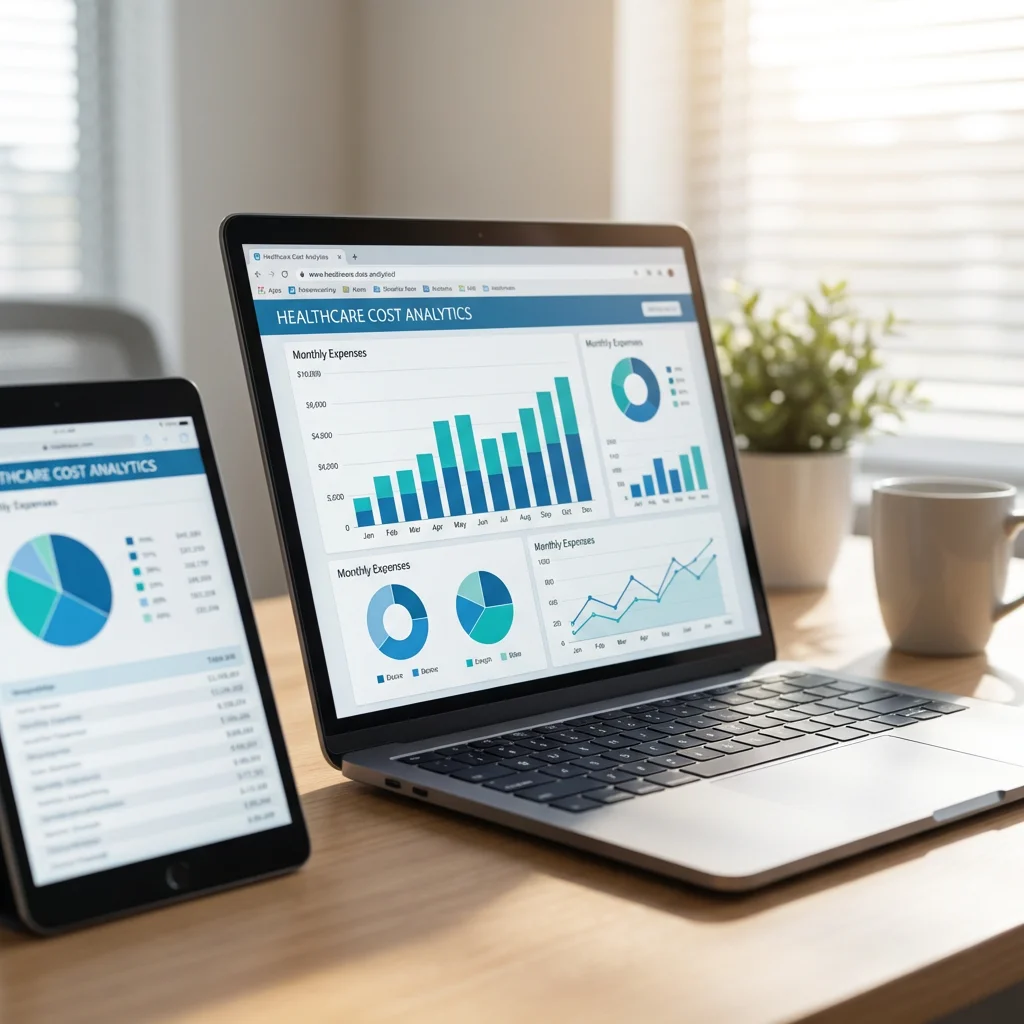
A true self-funded health plan data analytics dashboard is different. It is built on the employer's own claims data, refreshed frequently, and structured so the finance team can trace any number back to its source. It answers questions before they become expensive problems, and it gives the CFO a direct view into what is driving cost and risk.
What Trust Actually Requires in a Health Plan Dashboard
Trust in a dashboard does not come from better charts. It comes from how the data is sourced, updated, organized, and verified. A CFO should expect four things before treating a dashboard as a decision tool.
Independent data source
The dashboard must run on claims data owned by the employer, not on a filtered extract provided by the carrier or TPA. Independence means the analytics layer is separate from the parties whose pricing, rebates, and fees are being analyzed. When the data passes through the vendor first, the vendor decides which fields to include, how to categorize claims, and whether certain financial arrangements are visible at all.
Timeliness
Quarterly PDFs describe a plan that no longer exists. By the time the report is reviewed, the membership, provider contracts, and drug mix may have changed. A useful dashboard refreshes near real time, or at least monthly, so the CFO can see emerging trends while there is still time to respond.
Granularity
Aggregate spend is not actionable. The dashboard should break costs down by claim category, provider network, facility, service type, pharmacy line item, member cohort, and geography. Granularity is what turns a trend line into a conversation with a vendor or a targeted intervention.
Clear audit trail
Every figure should be traceable back to a specific claim, payment, adjustment, or contract term. If the dashboard shows a spike in outpatient surgery costs, the CFO or analyst should be able to drill down to the claims behind it. Without that trail, the dashboard becomes another black box.
The Metrics a CFO Dashboard Should Show
The right metrics answer the questions a CFO actually asks: Where is the money going? What is changing? What could blow up the budget? What are we paying for that we may not need? The table below outlines the core metrics an independent dashboard should include.
| Metric | What it answers | Why it matters |
|---|---|---|
| Per-employee-per-month cost trend | Is total plan cost rising, falling, or flat on a consistent membership basis? | It gives the CFO a normalized baseline for budgeting and for evaluating vendor performance over time, separate from headcount changes. |
| Large-claimant tracking and stop-loss lasering exposure | Which members are generating high claims, and is the stop-loss carrier likely to exclude or surcharge them? | Lasering, when a stop-loss carrier applies a higher deductible or exclusion to a specific individual, can shift large costs back to the employer. Tracking this early helps the CFO model renewal exposure and decide whether to adjust coverage. |
| Pharmacy and PBM spend, plus rebate reconciliation | What is the plan paying for drugs, and are rebates flowing back as expected? | Drug costs are often one of the fastest-moving parts of a health plan. Reconciling rebates against actual utilization is essential to verify PBM contract terms. |
| Network discount versus billed charges | Is the network delivering meaningful discounts, or are billed charges rising enough to offset the discount? | A discount percentage alone can mislead. The CFO needs to see the relationship between billed charges and allowed amounts to judge whether the network is creating real value. |
| High-cost claim categories | Which service categories, conditions, or procedures are driving the majority of spend? | Identifying the top cost categories lets the benefits team focus vendor negotiations, clinical programs, and member communications where they can have the most impact. |
| Plan versus benchmark | How does the employer's cost, utilization, and unit price compare to similar self-funded plans? | Benchmarks provide context. They help the CFO distinguish between market-wide trends and problems that are specific to the plan's design or vendor arrangements. |
Why Independence Is the Core Differentiator
Carrier and TPA reporting is not necessarily inaccurate, but it is inherently limited. The organization producing the report has contracts, pricing arrangements, and incentives that the CFO may want to examine. Spread pricing, retained rebates, network markups, and administrative fee structures are often not visible in standard reports because the vendor has no business reason to surface them.
Independent analytics changes the relationship. Because the dashboard is built on the employer's own claims data and managed outside the carrier or TPA, it can show what the vendor reports leave out. The CFO can compare the vendor's invoice to the underlying claims, reconcile rebates to utilization, and test whether network discounts hold up when billed charges are taken into account.
This is the difference between monitoring and auditing. A carrier report monitors activity. An independent self-funded health plan data analytics dashboard audits it. That distinction is what makes the numbers credible enough to act on.
Data Governance and Privacy: What the CFO Should Verify
A dashboard that holds detailed health plan data must be built with privacy and access controls from the start. CFOs do not need to become compliance officers, but they should know the basics of how their data is protected.
HIPAA and PHI handling. Claims data contains protected health information. Any vendor that touches identifiable claims data must operate under a business associate agreement and follow HIPAA safeguards for access, transmission, storage, and breach notification.
De-identified versus identified data. A CFO dashboard typically does not need member names or specific medical record numbers to show cost trends. De-identified or aggregated views should be the default for financial analysis. Identified data should be limited to the small group of people who need it for clinical or case management purposes, and access should be logged.
Role-based access. Not everyone in HR, finance, or benefits should see the same level of detail. The dashboard should allow administrators to define who can see summary metrics, who can drill to claim-level detail, and who can export data. Access should be reviewed periodically.
Business associate agreements. Every party that processes PHI on the employer's behalf, including the analytics vendor, cloud host, and any subcontractor, should be covered by a BAA. The CFO should confirm this is in place before any claims file is transferred.
Strong governance does not slow the dashboard down. It makes it defensible. A CFO who can explain who has access, how the data is de-identified, and where the audit trail lives is in a much stronger position with the board, the audit committee, and regulators.
From Dashboard to Decision
Data becomes valuable only when it drives action. A well-built dashboard enables the kinds of decisions that are difficult or impossible to make from a quarterly PDF. The examples below are not guaranteed outcomes. They are the kinds of decisions a CFO can make when the numbers are trustworthy.
- Renegotiating a PBM contract. If pharmacy spend is rising faster than utilization and rebate reconciliation does not match the contract terms, the CFO has the evidence needed to push for a different pricing structure or a transparent pass-through rebate model.
- Adjusting stop-loss coverage. Tracking large claimants and potential lasering exposure helps the CFO decide whether to change the stop-loss deductible, add a specific deductible layer, or negotiate renewal terms before the carrier applies exclusions.
- Steering members to higher-value networks. When the dashboard shows that one network delivers lower total cost for the same service categories, the CFO and benefits team can adjust plan design, communications, or steerage tools to direct more volume there.
- Targeting a high-cost condition with a point solution. If a small number of conditions or procedures account for a large share of spend, the employer can evaluate a condition-specific vendor, care navigation program, or prior authorization change and measure the result in the same dashboard.
Each of these decisions depends on having data that is independent, timely, granular, and auditable. Without that foundation, the CFO is left with opinions and vendor assurances.
Building a Dashboard CFOs Can Trust
Med-Vision builds independent analytics dashboards on the employer's own claims data, separate from carrier and TPA reporting, so CFOs can see what is actually driving plan cost and risk. If you are ready to move from quarterly PDFs to a dashboard you can make decisions from, contact us to request a demo.
Get Your Free ASO Contract Guide
Discover the 10 contract clauses costing employers millions.